Chart Pattern That Predicted Bitcoin’s Ongoing Rally: More Upside to Come
- In March, few expected Bitcoin to be in the place that it currently is in.
- The coin is up over 200% since the lows of March, showing that the crypto market is far from dead.
- Back at the lows, there were some that feared that cryptocurrencies wouldn’t be around for much longer.
- Bitcoin’s ongoing rally was predicted by some analysts, though.
- One such analyst predicted the cryptocurrency would retest $10,000 by May, just months after the crash.
- The chart pattern he used to predict this price action suggests that Bitcoin has room to extend higher.
- This sentiment is in line with the outlook for BTC shared by another trader who predicted the rapid recovery in Bitcoin’s price.
Textbook Chart Pattern Predicts Bitcoin Has More Upside
When Bitcoin crashed as low as $3,500 on March 13th, few expected the coin to bounce back as fast as it did. In fact, at the time, there were many that asserted the cryptocurrency was on its way to $1,000 and potentially lower.
There were some, though, that were predicting that Bitcoin would undergo a rapid reversal.
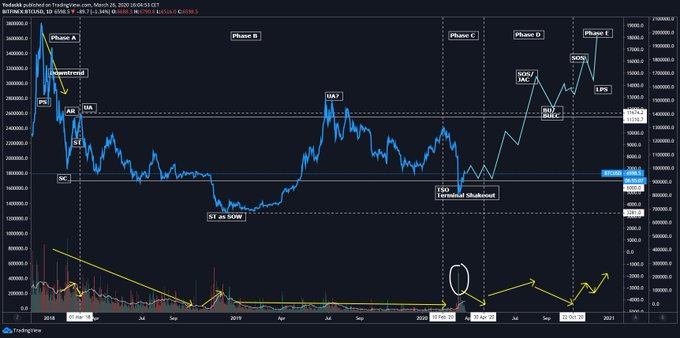
One such analyst shared the chart below. It suggested that the cryptocurrency was trading in a macro accumulation pattern popularized by Richard Wyckoff.
This Wyckoff Accumulation analysis suggested that by May or June, the cryptocurrency would hit $10,000, then correct. This happened. The analysis also predicted that Bitcoin would undergo another leg higher after bottoming in July. This, too, happened.
While the analysis was not fully accurate in that it predicted Bitcoin would hit $14,000-15,000 in its second leg higher, it was accurate in predicting the timing and overall directionality of the cryptocurrency.
That same analysis now suggests that Bitcoin is primed to move higher after the correction and subsequent consolidation.
Chart of BTC's price action with a a Wyckoff Accumulation analysis by crypto trader Coiner-Yadox (Yodaskk on Twitter) from March 2020.
Chart from TradingView.com
On-Chain Trends Print Similar Picture
On-chain trends are in line with the bullish picture painted by this analysis.
As reported by Bitcoinist, there is a confluence of on-chain signs that indicate Bitcoin is primed to move higher on a macro time frame. CryptoQuant, a crypto-asset analytics firm, recently shared 10 of these trends. They are as follows:
- Miners’ position index
- Puell Multiple
- Hash Ribbons
- All Exchanges Outflow Mean
- All Exchanges Reserve
- Stablecoin Supply Ratio
- All Exchanges Stablecoin Reserve
- MVRV Ratio
- Network Value to Metcalfe Ratio
- Stock to Flow
One key reason why Bitcoin is poised to move higher is that the hash rate of the network is setting new all-time highs. This, to many analysts, suggests an underlying bull trend.
Photo by Stephen Leonardi on Unsplash
Price tags: xbtusd, btcusd, btcusd
Charts from TradingView.com
Chart Pattern That Predicted Bitcoin's Ongoing Rally: More Upside to Come


Post a Comment
Post a Comment