Here’s Why An Analyst Is Eyeing a Bitcoin Drop Toward $9,750
- Bitcoin sustained a strong drop on Thursday after peaking at $12,000 earlier this week.
- The leading cryptocurrency now trades for $10,300, having collapsed around 15% from the local highs.
- BTC closed its daily candle below pivotal support levels, a technical signal that does not bode well for bulls.
- While $10,000 has held for the time being, analysts think that at least one leg lower is likely.
- This final leg lower will take Bitcoin to at least $9,750, a number of traders have suggested.
Bitcoin Could Drop Towards $9,750: Here’s Why
Bitcoin underwent a decisive bounce at $10,000 after temporarily tapping and sliding below this level on Thursday evening and Friday morning. The leading cryptocurrency, as aforementioned, now trades $10,300 due to that bounce.
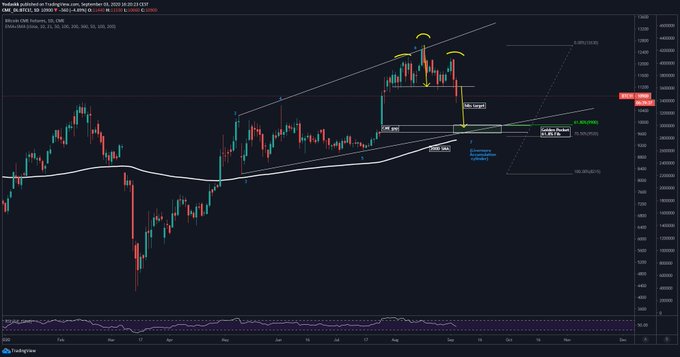
According to one trader, the cryptocurrency is primed to see another leg lower towards the $9,755 range. This would mark another approximately 5% drop from current levels.
The reason why such emphasis has placed on this price region is for a number of reasons. The trader who shared this sentiment that $9,755 lines up with a strong confluence of technical and horizontal support levels. These levels are as follows:
- Bitcoin’s 200-day simple moving average. This moving average is often seen by analysts as a level an asset must hold to maintain a bullish bias.
- The target of a textbook head and shoulders formation.
- A CME BTC futures gap. Futures gaps have filled over 95% of the time thus far.
- The “Golden Pocket,” the 61.8% Fibonacci retracement of the rally.
- A Livermore Accumulation Cylinder low.
This confluence of support levels suggests that Bitcoin, at least to maintain its bull trend, will bottom and bounce in this price region.
Chart of BTC's price action over the past few months with an analysis by crypto trader Coiner Yadox (Yodaskk on Twitter). Chart from TradingView.com
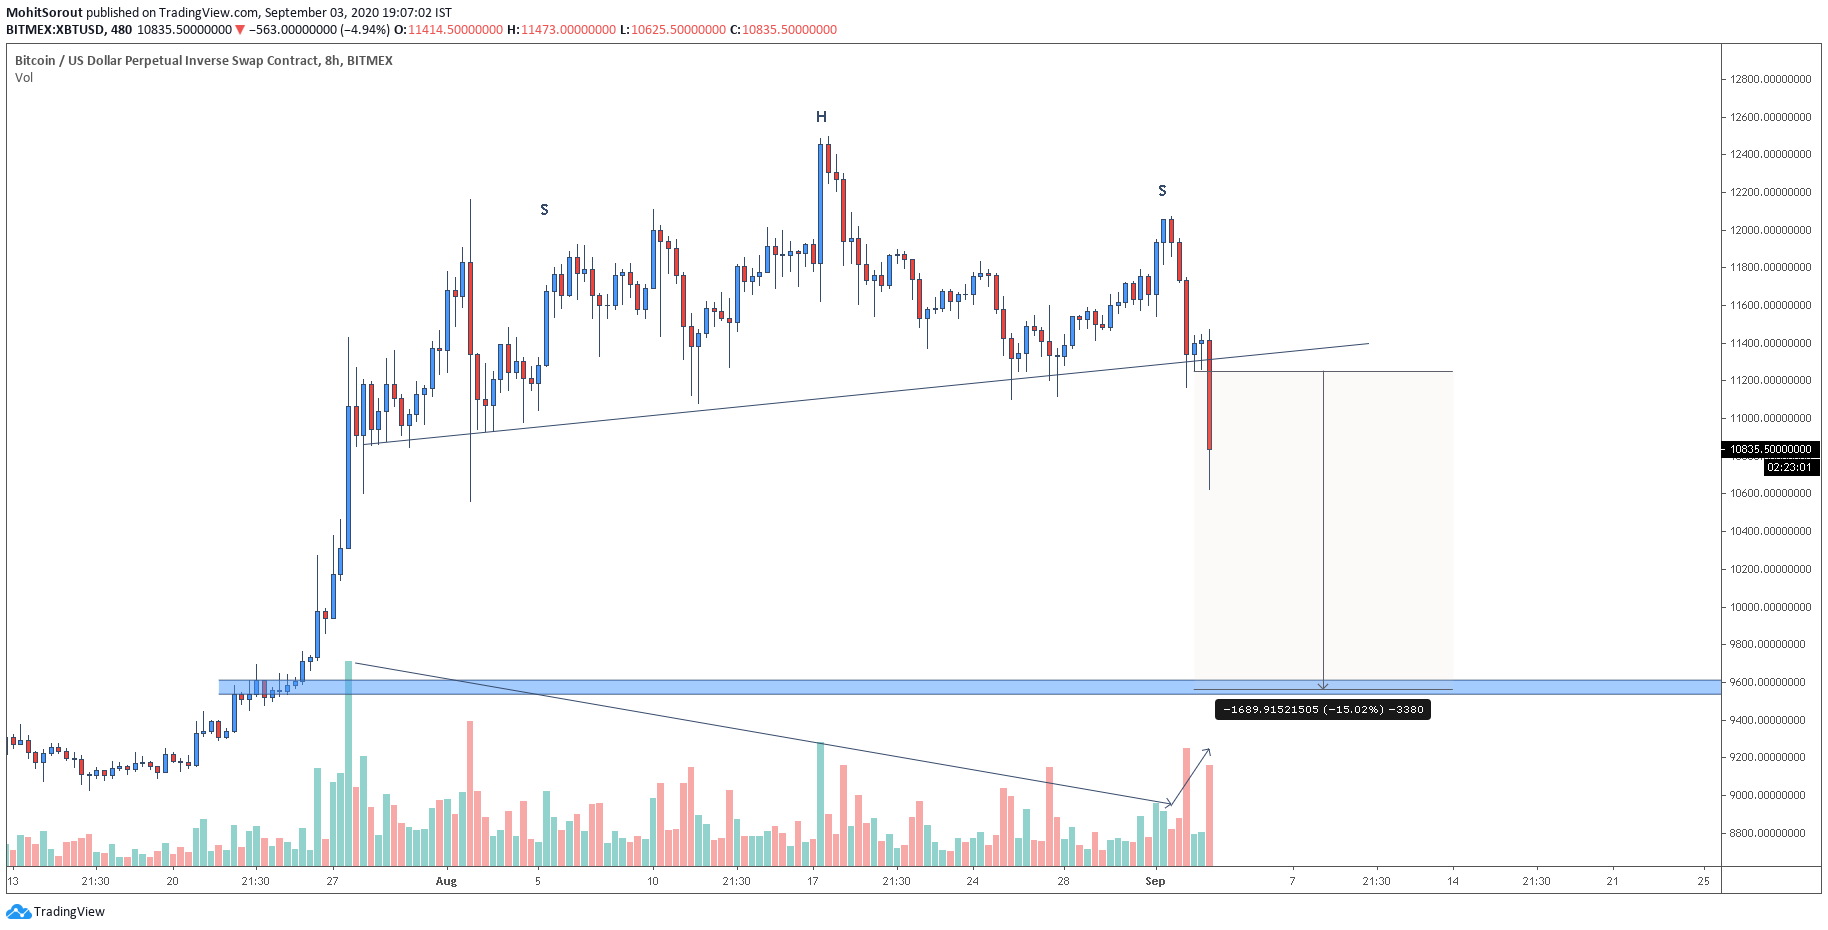
Mohit Sorout, a founding partner of Bitazu Capital, has echoed the expectation of a move towards the $9,700 region. Sorout postulated that it may actually move even lower than that level.
He published this chart during the drop, noting that his target for the correction is $9,600. He previously noted that this price is one where he thinks it may be wise to flip long.
Chart of BTC's price action over the past few months with an analysis by crypto trader Mohit Sorout. Chart from TradingView.com
Could Drop a Bit Lower Than That
The downtrend may bottom a bit lower than that, though.
Cole Garner, a cryptocurrency analyst, noted that order book data indicates that a Bitfinex buyer seems to be putting bids in the $8,800 region.
This is relevant because Bitfinex’s order book has been an extremely accurate indicator for Bitcoin’s price over recent months. The order book on the exchange flashed strong buys in the $9,000s in June and July, marking local bottoms prior to the strong uptrend in August.
Nice to see you again #BitfinexWhale
Smart money has their bids sitting at $8800
I expect the bottom will likely be around there pic.twitter.com/DPBHUKrCFr
— Cole Garner (@ColeGarnerBTC) September 4, 2020
Photo by Mitchell Orr on Unsplash
Price tags: xbtusd, btcusd, btcusdt
Charts from TradingView.com
Here's Why An Analyst Is Eyeing a Bitcoin Drop Toward $9,800


Post a Comment
Post a Comment