Key On-Chain Analysis Suggests Bitcoin Could Retrace After 50% Surge
- Bitcoin has once again begun to thrust higher despite uncertainty in traditional markets.
- The coin currently trades for $16,450 as of this article’s writing.
- Analysts fear that a retracement is likely as on-chain trends and technical trends seem to have begun to favor bears.
Bitcoin Could Retrace Soon, Analysts Say
Bitcoin has once again begun to thrust higher despite uncertainty in traditional markets. After a day of 1% losses for leading U.S. stock indices, Bitcoin pushed past $16,000 for the first time since early 2018.
The coin currently trades for $16,450, a year-to-date and multi-year high. Bitcoin closed its daily candle above a key technical level in the low-$16,000s in a win for the bull case.
Analysts have begun to expect a retracement, though. Despite consistent closes above key support levels, there are expectations of a retracement lower as certain on-chain trends and technical trends seem primed to drive the leading cryptocurrency to the downside.
Many argue that it would actually be healthy for Bitcoin to correct here as that would reset the expectations of this market and minimize the amount of leveraged speculation that normally takes place near blow-off tops.
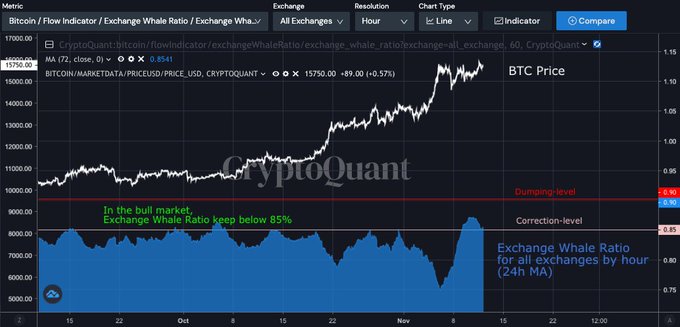
Ki Young Ju, the CEO of crypto data firm CryptoQuant, shared the chart below recently, showing a potential correction coming up. The chart shows Bitcoin’s price action, along with an exchange whale ratio (24-hour moving average). The ratio attempts to depict how much Bitcoin whale addresses deposited in exchanges.
The chart suggests that there has been an increase in the amount of whales depositing BTC into exchanges, which may trigger a retracement.
Chart of BTC's price action over the past few weeks with analysis by Ki Young Ju, CEO of Crypto Quant.
Source: BTCUSD from TradingView.com and CryptoQuant
Other analysts have begun to call for a retracement in the days ahead.
Some look to other technical trends such as the bearish divergence forming between Bitcoin’s one-day candle chart, along with the relative strength index. Bearish divergences are when an asset’s price action moves against a down-trending momentum indicator, suggesting that bulls are losing dominance in an uptrend.
One More Leg Higher
Some expect this market to undergo one more leg higher, though. Referencing the recent CNBC segment in which the outlet covered the ongoing Bitcoin rally, one historically accurate analyst said that while he thinks a top is nearing, it may be unwise to “fade this early”:
“It is all happening right in front of our eyes. Give the fomo a few days to pick up and don’t fade it too early, but a small fomo army is about to get trapped soon. A top is near.”
Bitcoin has also not seen a “blow-off” top candle that analysts have said they expect in the near future.
Featured Image from Shutterstock
Price tags: xbtusd, btcusd, btcusdt
Charts from TradingView.com
Macro Analysis Predicts Bitcoin Has Begun Rally Toward $100k


Post a Comment
Post a Comment